Background, Problem, Opportunity
In the area now called the United States, Indigenous peoples experienced widespread genocide, land dispossession, and forced migration by European settlers. These settlers, culminating in the United States federal government, still exert near total economic and political control, even as hundreds of Indigenous communities persist there today.
Scholarly research into this socio-political process, mostly by historians and anthropologists, has revealed a great deal about land dispossession and forced migration. Yet most empirical accounts are circumscribed to a particular tribe or small area of the continent. And when, or if, they present aggregate-level figures concerning land dispossession or forced migration, it is often based on imprecise measures.
In other words, scholars have yet to attempt to quantify at large-scales the process of colonization.
With the growing abundance of digitized records and geospatial methods, there exists a substantial opportunity to improve the both the scale and precision of the quantitative study of land dispossession and forced migration. Not only would this allow us to begin to estimate these general processes better, but perhaps more importantly, it would allow us to zero-in on the specific impacts of colonial practices over time and leading up to the present-day.
Of course, scientific research can never quantify the true depth of cultural, spiritual, political, and economic trauma perpetrated by settler colonialism. But efforts to catalogue, map, and quantify land loss can help to chart path-dependencies and current and future impacts, with the hopes of crafting more informed policies for justice and restitution.
Research Questions
Using the case of North America, focused on the area that is now called the United States, my research group – Paul Burow, Kathryn McConnell, Jude Bayham, Kyle Whyte, Gal Koss – are attempting to test research questions and hypotheses at scale. We published our first study in the journal Science a year and a half ago and are working on several new studies using the data and analytical framework I’m laying out for you today. So, in this paper/presentation I’m also drawing directly from this project as a way to lay out the general contours of a larger research initiative I’m leading, in collaboration with Dr. Kyle Whyte, an Indigenous scholar and professor at the University of Michigan.
Our approach focuses on two main research questions. We empirically assess these questions in the U.S. context, but they provide a framework that should be useful across most colonial contexts around the world. I’ll do my best to avoid getting caught in the methodological or analytical weeds.
First, we attempt to catalogue and quantify land loss for every Native tribe in the historical record. In other words, how much land was dispossessed? – both at the individual Tribe/group-level as well as in the aggregate across all tribes. If an Indigenous community still has a land base in the present-day United States, where do they live now? In their ancestral areas or were they forced to migrate to a different part of the continent? We can then aggregate these measures to understand the full extent of land dispossession and forced migration for all tribes combined.
Second, and perhaps more importantly, we investigate the continued impacts of land dispossession and forced migration. Historical research shows that tribes were often forced to lands that were viewed by the settler government to be less desirable. Of course, this raises important questions about the implications of their “new lands”, both at the time of relocation and into the 20th and 21st centuries as a multi-trillion-dollar land-based settler economy was built.
Notably, with the right approach, we can also begin to examine the impacts of climate change. Although early settler governments were unaware of the coming rise in global temperatures, with the right data, we can compare across time, assessing whether tribal lands today are in areas more vulnerable than their ancestral lands to the effects of climate change.
Open-source Dataset Construction
In order to examine these research questions, we created a new, large-scale open-source dataset to begin to catalogue instances of colonial land dispossession and forced migration. We employ a basic comparative-historical research design, collecting geospatial locations of tribes at two general time-points: (1) historical and (2) present-day. Because we are in the early stages of this project we use a very conservative definition of “historical” lands, defined as the earliest documented location of Indigenous peoples in a geographic area.
We compiled historical ancestral locations from myriad sources, including Indigenous nations’ own publications and public archives, digitized administrative records of land cession treaties made between Native nations and the US government, judicial records, and many other settler and tribal sources.
As we note in our Science article, constructing the historical location data involved difficult decisions concerning scale and historical lineage because contemporary tribes may be groups that identified as varied types of tribal formations during colonial periods even though historically their members may have associated to differing degrees with larger or more fluid social groups that were not themselves organized as “tribes”. They constitute themselves variously, by clans, kinship networks, or bands, in addition to more variable instances in which multiple tribes form a larger confederation or nation of associated tribes.
So, our effort in this project is ambitious, but from the very beginning was taken on with analytic humility, acknowledging these methodological and ethical difficulties as we sought to estimate historical locations prior to settler-colonial forced migration. We did so by (1) using multiple methods and aggregated data from many historical and contemporary sources to piece together reliable estimates that are (2) in the historical period, plotted in administrative areas large enough to accommodate for the spatial heterogeneity and diversity of Indigenous land tenure systems, boundaries, modes of occupancy, and territorial claiming.
All this is to say that we’re starting from the ground-up, and this is a living dataset of historical locations that will improve over time as we collect more tribal input and more historical records of colonization as they come to light.
In the past, scholars studying Indigenous communities often took an extractive approach to data collection. Here in this project we prioritize “data sovereignty” for Tribes whereby our data are open-source from the beginning and in collaboration with Native organizations. For example, our data are stored online by a Native-led data organization. Working together, we’re building a publicly available online function that will allow tribal members and others with reliable knowledge to submit geographical additions that will deepen the historical precision and reach of the data.
In what follows I’ll give some visual examples of the data collection process and then demonstrate the value of the data for examining research questions pertaining to climate risks and impacts.
Data Structure and Some Visual Examples
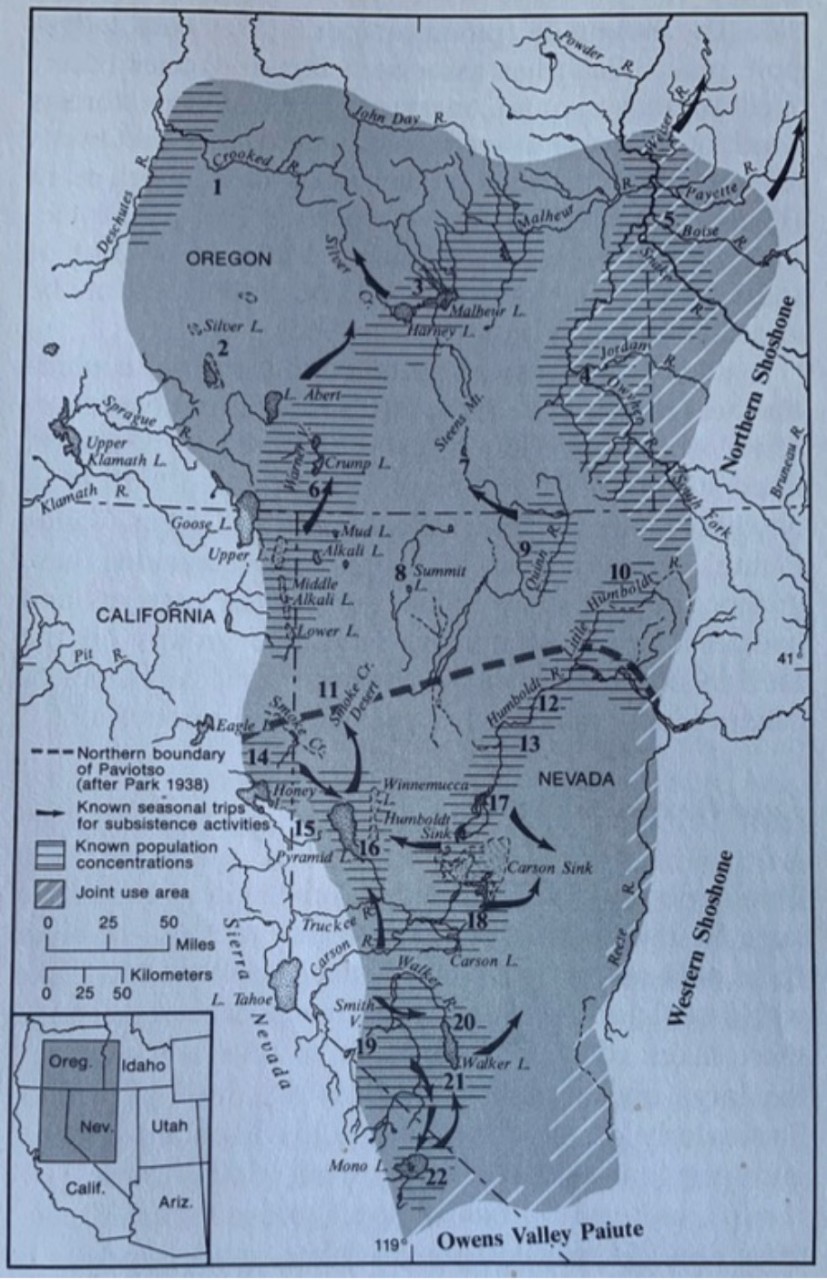
Figure 1 is an example of a typical map we use to reconstruct historical locations of Indigenous peoples. This particular map is from the Smithsonian, of the Paiute people in the Great Basin area of the continent. Areas known to be inhabited around the years 1800-1830 in what is today California, Oregon, and Nevada.
Again, these are imperfect, and a product of the settler-colonial record, but we do our best to pair geographic sources like this with oral history and public records provided by tribes themselves.
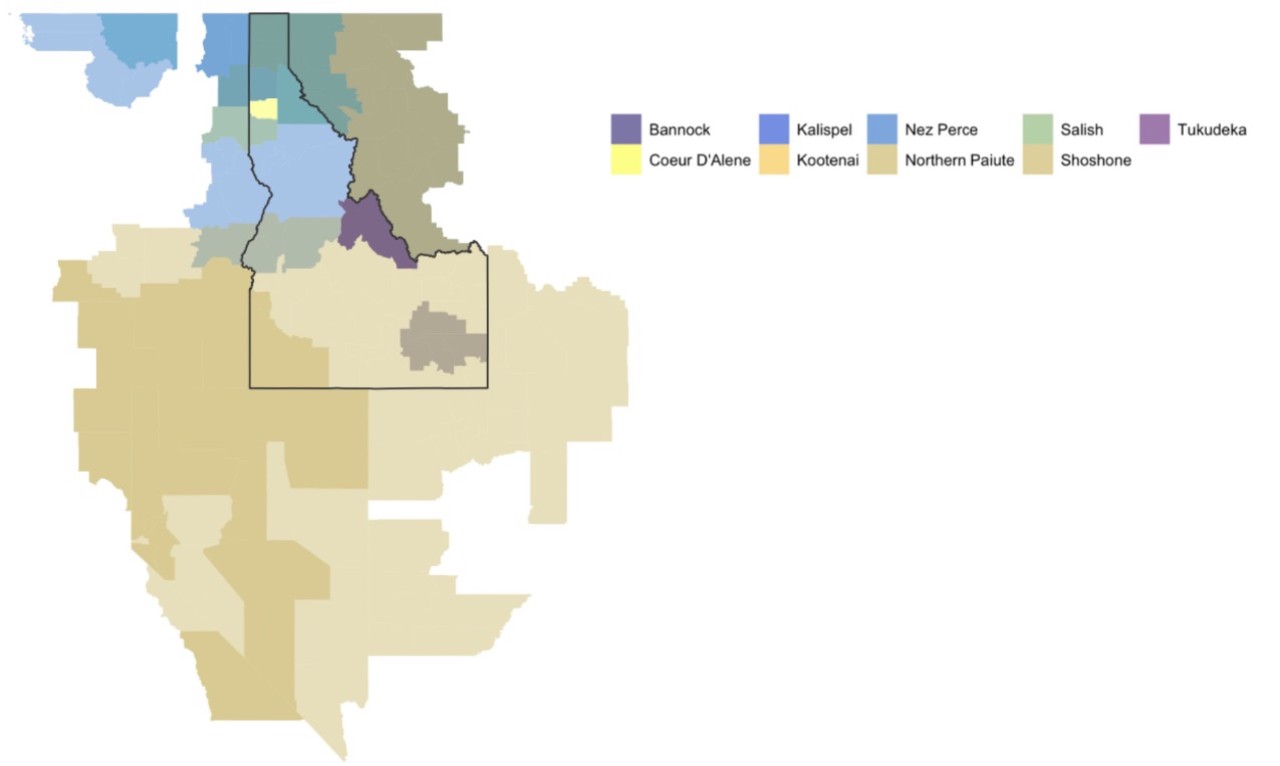
Figure 2 shows more historical maps, from the Bureau of American Ethnology, estimating tribal locations for what is now the area of the states of Alabama and Idaho. Over many years we compiled all available historical geospatial information like this for a total of 390 tribes.
Figure 3 shows what this looks like when it is cleaned up and digitized with geospatial software.
We manually paired every tribe’s historical location with their present-day locations, via the U.S. Census Bureau. The present-day locations are the reservations to which they’ve been confined, often in the mid to late 1800s.
The particular legacy of colonialism in the U.S. drives some methodological decision-making, and these decisions may look very different in Europe, South America, Africa, or elsewhere.
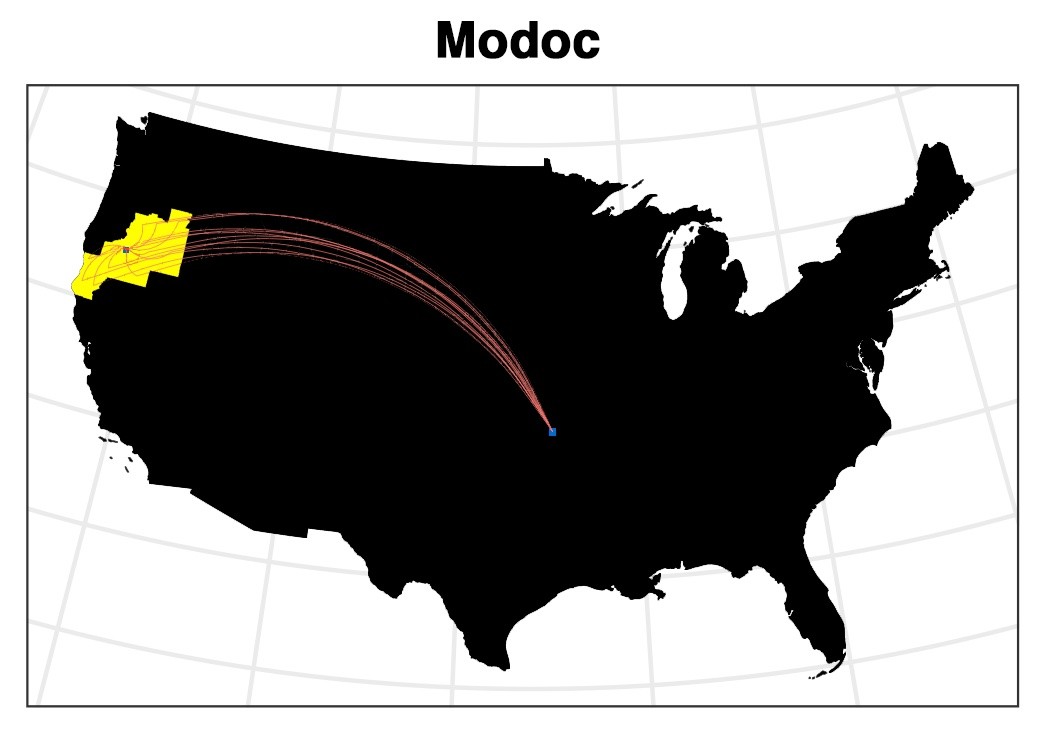
In Figure 4 I present an example of a land dispossession dyad, pairing these historical data with known present-day locations. This figure presents the dyad for the Modoc tribe. You can see in their earliest-known historical locations in Yellow, to the left, on the western edge of the map. Most of those lands were dispossessed and the tribe was forced to migrate across the continent to present-day Oklahoma (the tiny blue dot).
Scaling up to the entire dataset, Figure 5 displays the geographical and temporal distributions of land for all tribes. The top left displays known historical locations. It is important to note, for this study, and for future studies that most Indigenous people shared the same lands, so multiple tribes are present in the same place. The bottom left of this figure displays the location of tribes in the present-day, which with the naked eye reveals a sharp reduction, of about 94 percent. The figure on the right visualizes the aggregate reduction for each tribe.
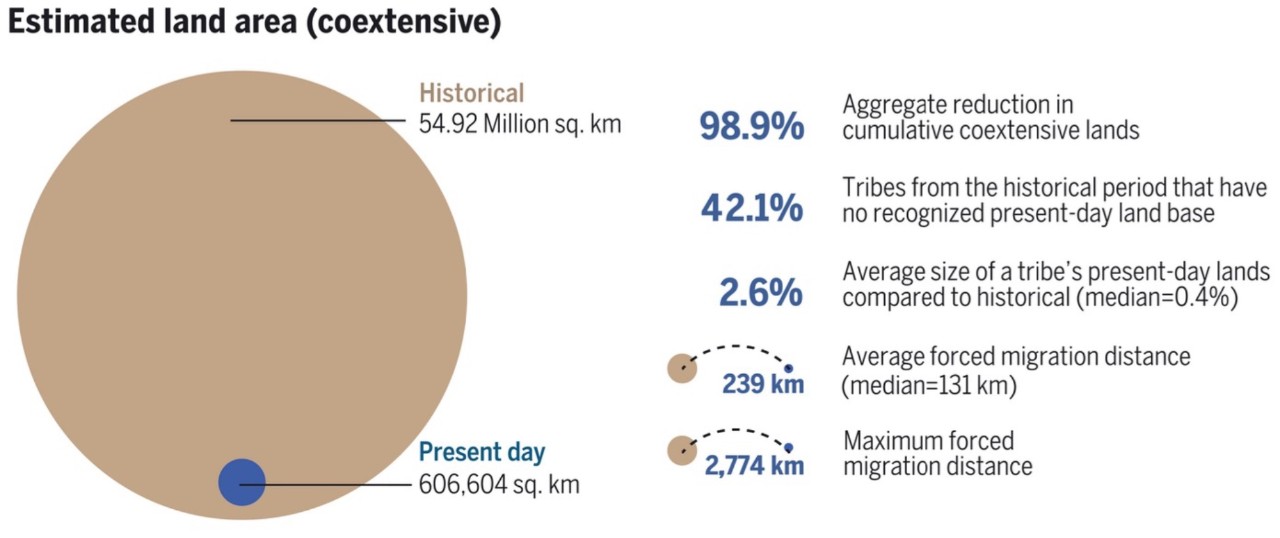
We’ve also attempted to catalogue and visualize top-line figures of land dispossession. For example, on Figure 6, we show the reduction in square kilometers, the brown circles on the left representing historical lands and the much smaller blue dot representing the aggregate total of present-day tribal lands. Notably, 42 percent of tribes from the historical period no longer have any land base today. For them, colonial land dispossession was totalizing.
Examining Climate Change Risks and Impacts
Quantifying land dispossession in the aggregate is useful, but the real payoff of this data structure is to compare each tribe’s historical lands to their present-day lands across several dimensions. For example, were tribes moved to lands that would become more – or less – at risk for climate impacts? In other words, what if tribes were still living in their ancestral areas, as compared to where they were forced?
The difficulty in comparing across such large timescales is that most variables are influenced by settler activities during the 19th and 20th century. To help overcome this issue we use indicators that are largely durable across time.
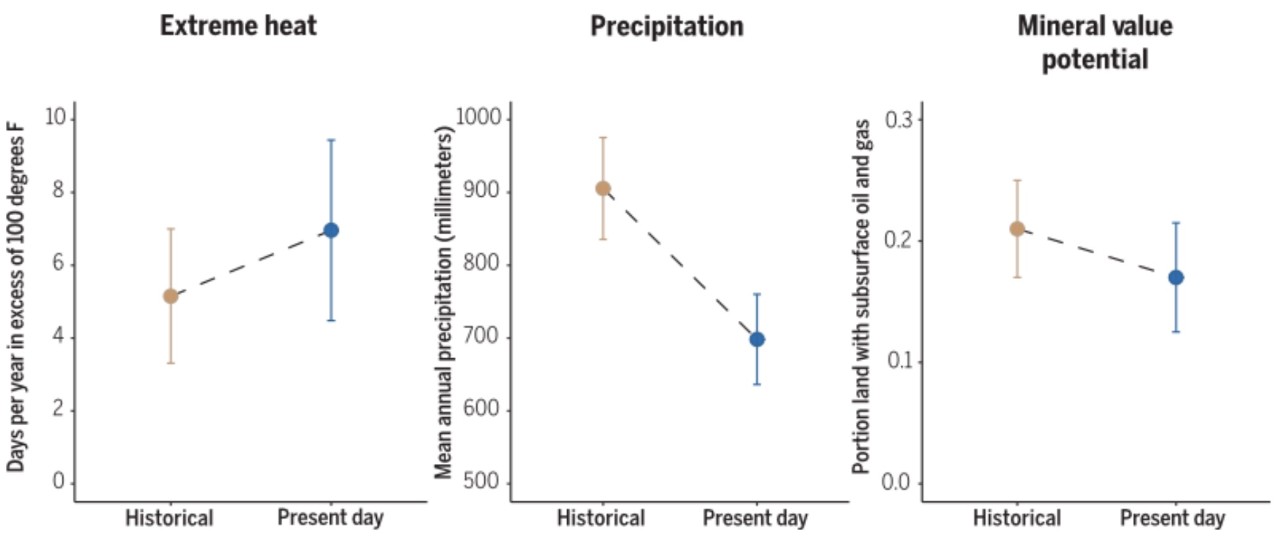
In this paper/presentation I’ll very briefly present a few examples related to climate change risks and impacts. For example, here in Figure 7 we compare – across all tribes – how historical lands compare to present-day lands with regard to (1) extreme heat days and (2) annual precipitation. This figure illustrates that tribes, on average, were moved to hotter lands and lands with less precipitation.
Researchers might also examine, as we do in our initial paper, wildfire risk and drought. For example, we found that about 50 percent of tribes saw increased wildfire risk on their present-day land as compared to their historical areas.
Again, it is important to stress that colonial regimes had – at the time – no knowledge of increases in greenhouse gas, but they did move tribes to less desirable lands, which in the case of the United States, are hotter, drier, and at a greater risk for current and future climate impacts.
Conclusion
In summary, I believe – along with my collaborators – that despite serious analytical and ethical issues of quantification, the practice of georeferencing land dispossession and forced migration at large scales provides new empirical insight to improve our scientific understanding of the legacies of colonialism. And not just for posterity’s sake, but to begin to establish open-source datasets to expand knowledge about the path-dependencies that continue to shape the daily experiences of Indigenous peoples today and into the future.
The data collection process will look in different in different parts of the world, and in some places it may be impossible to assemble reliable data at scale, depending on the quality of the historical record, especially if the accuracy of the historical record is intentionally hidden or distorted by colonial interests. Nevertheless, using a mixture of available data sources can help to overcome some of these difficulties, especially Tribal sources and other non-government sources, such as journals, oral histories, diaries, church records, archeological evidence, and the like.
Furthermore, any macroscopic research program like this must prioritize continued data collection, Tribal input, historical validation, and synthesis with ongoing historical and qualitative approaches. As data collection improves we will be able to provide more information at larger scales, deepening our time horizon into the past, while at the same time improving estimates of vulnerability now and into the future, with the hope that this information can provide a basis for ongoing efforts to de-colonize, support movements for Tribal self-determination, and promote the common good.
* This presentation draws directly from, and describes a larger paper and research project “Effects of Land Dispossession and Forced Migration on Indigenous Peoples in North America”.